Fourier Analysis in a Nutshell
Fourier transforms are used to decompose waveforms into a set of discrete frequencies and to reconstitute them. This is how the core of the idea works.
Page Contents
In a Nutshell
Fourier Transforms can be used to :
- Analyse a signal to isolate its constituent frequencies
- Synthesise a signal by combining individual frequencies
A signal is a name given to measurement over time, normally recorded as discrete values for easy storage, transmission and manipulation.
A stream of data like this can hold a pattern spread out in time. For example, a recording of a chord being played on three keys of a piano will contain a signal that represents the mixture of all three frequencies. A single frequency is a sine wave with a particular wavelength. When three frequencies are present, each measurement contains the sum of the frequencies at that instant.
The content of the signal may vary with time so that subsequent sets of data may differ from each other. In the example, one of the notes could stop playing or an additional note might be added. A Fourier Analysis of a series of signal data sets may discover different frequencies.
To make things simple, the following explanation is based on analysing a constant signal recorded over a short period of time.
Signal Synthesis
Signal synthesis is performed by the Inverse Fourier Transform. An illustration of the way individual frequencies combine was illustrated by Lucas Vieira on his blog with an interactive tool called FourierToy (now unavailable). It shows individual frequencies and amplitudes as well as the summed result.

The screenshot of the FourierToy in action shows how 4 frequencies can be combined to make an approximation of a square wave.
Signal Decomposition
Fourier Analysis is the method that enables the process of determining what frequencies are present in a given signal.
Decomposition of Light

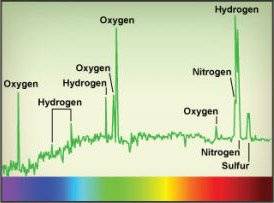
The same idea can also be applied to the identification of frequencies present within light coming from distant stars. The light is decomposed into a power vs frequency plot and the peaks at particular frequencies are used to identify the elements that are emitting light from those distant objects. Refer to the HubbleSite.
Decomposition of Sound
This type of operation can be used, for example, to analyse the sound an engine makes, where the frequencies are matched to rotating components within the engine. By comparing changes to these frequencies with a health engine, faults within the engine can be identified before they develop into failures – notably useful in helicopter engines.
How FFT’s Work
Fast Fourier Transform (FFT) libraries can achieve frequency decomposition incredibly quickly by employing a sequence of mathematical optimisations to the process. Although there are numerous different algorithms adapted to specific purposes, it’s helpful perhaps to have a rough idea of how one variant of a commonly used technique works.

One such variant is the Cooley-Tukey algorithm. The basis of the algorithm is to take a sample window containing 2^n samples. This number of samples can be divided in half repeatedly and leave no remainder.
The Cooley-Tukey algorithm creates two child sets from the sample window, each being half the size of the original. One set is composed of samples with even offset indexes and the other set is composed of samples with odd index numbers. In other words, the samples are distributed alternately from the first set to two child sets. This process of dividing and filling goes on until each set contains just two sample points.
The fully decomposed sets with two measurements are pairing the most widely separated measurements, which is equivalent to looking for the longest wavelength in the sample window.
The algorithm then selects the first of the smallest sets which contains two samples and tests for a whole or half-wavelength cycle fit using the following sequence
- Rotate the two sample so their midpoint phase value is at zero (this involves a precomputed ‘fiddle factor’ for each level).
- Add the two samples – a zero indicates a half wavelength is present.
- Subtract the two samples – a zero indicates a full wavelength is present.
The result is carried back to the previous layer where a longer wavelength is tested in the same way. The results of all the stages are combined to make a final power vs frequency result.
References
- YouTube: IllinoisDSP
- YouTube: Aaron Parsons
- Audiograins.com
Disclaimer
Care has been taken to keep the information in this article as accurate as possible but errors are possible, so be aware of the full disclaimer here.
