
The Search for a Random Number Generator
This page documents a search for a pseudo-random number generator (RNG) implemented as a 32-bit number that uses itself as a source for each new number. RNG’s can be used to generate synthetic data to test a system or provide unbiased choices, such as the actions of an element of a game or simulated environment.
At the end of the article is the pseudo-code to implement the essential core of your own generator

Page Contents
Types of Random Number Generators
True RNGs

A true random number generator is a source of numbers that have no discernible bias or pattern. A high-quality RNG source will provide numbers that have an equal chance of occurring. There are no patterns in the sequence of numbers it produces. The source of such numbers is often rooted in the physical environment, for example, the selection of lottery balls or dice throws.
Pseudo RNGs

A pseudo-random number generator is a calculation that provides a source of random numbers using a calculation. Because they are generated by an equation, they are not as random as they appear to be. A good pseudo-random number generator will still provide useful statistical randomness.
Pseudo RNG’s are useful for testing and research in that each unique starting point (
XOR Shift Pseudo RNGs
The specific type of RNG we are investigating here uses a 32-bit number to do all of its work. In 1981, Intel introduced its first 32-bit microcomputer. In this CPU, an integer type is represented by 32 bits and can represent 4294967296 positive integers.
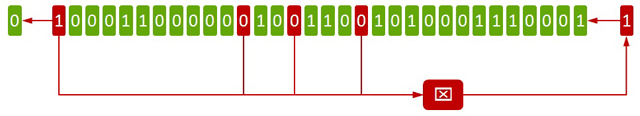
It is possible to generate a random number from an existing one by combining the values from fixed bit positions within it and pushing the resulting single bit into the lowest order bit position. All the bits move one place left, the topmost bit is lost and the new bit is given the empty slot in the zero position.
Useful Properties of an XOR Shift RNG
We would like to have a generator with:
- A maximum-sized sequence length of 0xFFFFFFFF (4294967295)
- A minimal number of tap points for speedy execution
- An even distribution of values
- A wide distribution of differences between values
Zero is a Special Case
Since the XOR Shift Pseudo RNG works by feeding back combinations of bits one at a time to the first position we can deduce that once the RNG has a zero value, it will never change. For this reason, you cannot use zero as a starting pattern for the RNG.
Zero Will Not Be Created
A pattern with any non-zero bits on or below the highest tap position cannot generate an all-zero pattern. If only 1 bit is set and is crossing the highest value tap position all other tap positions will be zero, in which case the outcome will be to generate a value 1 and that value will be shifted into the first bit position.
We can now state that:
- A zero value can only generate zero.
- A non-zero value cannot create zero.
- The maximum sequence length will be = (232 – 1) = 4,294,967,295.
Prototyping
When is a Test Complete?
The sequence of numbers is not really random. When a number is generated for the second time, the list of unique numbers it can generate has ended.
We can extend our knowledge of the RNG with the following:
- The RNG will generate the same number sequence from any given starting point.
- The sequence of numbers is finite.
- Each of the numbers in the set is unique.
- The sequence lengths will depend on the tap positions.
An easy way to detect a sequence length is by using one of the numbers in the set as a start and end marker. But we cannot be sure that a number will be in the sequence before we start the test. If it isn’t then the test will not terminate.
To take the ‘infinite loop’ condition into account, the sequence length was checked as well as the start-end marker. If the sequence counter exceeds the maximum count possible we know that the start value we used as a marker is not generated naturally by the current
A Better Start-End Value
We need to choose a start-end marker that is part of the sequence. How are we to know when that is?
The RNG will have created its first naturally generated number as soon as all the original bits have been cycled out of the RNG. This happens in just 32 cycles. After that, all of the original bits have been discarded and have been replaced by naturally generated bits.
The naturally generated number can only be part of the sequence and it can be used as a reliable start-end marker.
Is There Only One Sequence Per Tap Pattern?
Consider a generator with just the top bit providing feedback, and a single bit set. If you apply 32 cycles to it, you will end up where you started. That makes one sequence. Now if you do the same thing with 2 bits set in the start pattern, you have a new sequence. In fact, any pattern of bits will work.
This shows that:
- There may be more than one sequence per tap pattern
But since we are looking for a full-length sequence, we know that if there is room for more than one sequence to exist, none of them will be full-length, and we can discard that tap pattern.
Maximum Sequence Lengths
We are looking for sequence lengths that cover every possible non-zero number that 32 bits are capable of. A test was set up to check the response of generators that use 1, 2, 3, 4, 5 and 6 tap bits. For each one, all permutations of the positions of the tap bits were examined for sequence length. The result is expressed as a percentage of the maximum length, which I refer to as ‘coverage’.
For example, Graph 2 uses two tap bits and shows that one of their permutations reached 99% coverage. The first 100% value occurs on graph 4 using a permutation of 4 tap bits.
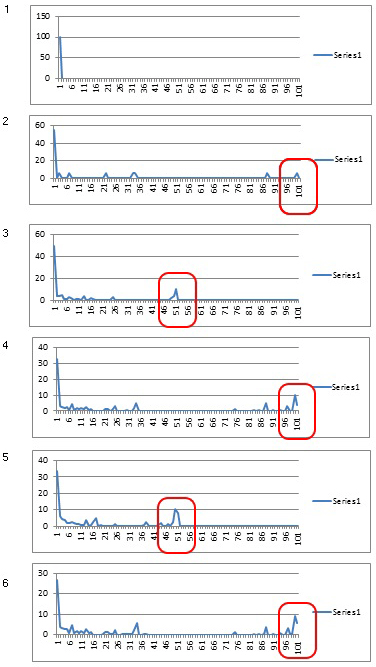
We can see that when an even number of tap bits is used the generator can reach 100% coverage whereas an odd number of tap bits limits the coverage to 50%.
- A full-length sequence cannot be achieved with an odd number of tap positions
Extended testing using up to 32 tap bits gave partial results that agreed with this finding, but it was not possible to calculate them all.
Coverage Investigation
An experiment was set up to discover all of the sequence lengths (coverage %) generated from all 4495 permutations of 4 tap bits starting at 0x0000000F and ending at 0xF0000000. The purpose was to find out if there were any underlying patterns that could be used to reduce the scope of the search when testing all possible numbers of tap bits.
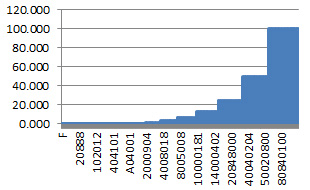
What we find is that the maximum size of the sequence lengths doubles each time the topmost tap point moves forward one position. This is to be expected because the number under the highest tap position is doubling in size each time.
When the topmost tap position is reached, 178 out of 4495 patterns (4%) achieve full coverage.
This can be summarised as:
• The longest sequence length possible is controlled by the highest tap position.
• Only tap patterns with the top bit set have the possibility of reaching 100% coverage.
Viable Permutations Count
We can remove all the tests in which the tap pattern does not have the top bit set, as they will not be able to reach 100% capacity. Comparing all permutations to the ‘top bit set’ permutations, we can see that we can save about half the total testing time.
User Improvements
Tests showed that 32 bit RNG’s were performing very well and this made it worthwhile to think about improving the output from a user’s point of view.
Refresh the Pattern Completely
If we perform a single shift operation the result is usable and quick. The result will contain 1 new bit and 31 old bits that have moved up one position.
The relationship between successive numbers is easy to follow. However, if we replace all of the bits with fresh values, the relationship of successive numbers is much harder to see. This is a desirable feature for an RNG.
To implement the complete refresh, the RNG is called 32 times and only the last value is used. When testing the sequence length using this method, it was found that the new sequence length remains maximal, why is this so?
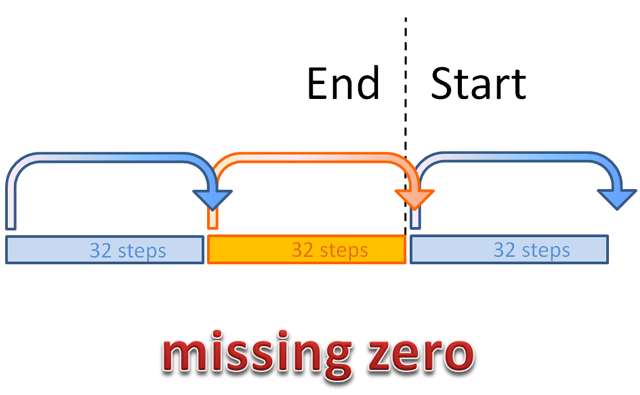
The answer is that the full list of random numbers does not contain zero and dividing by 32 leaves a remainder. Each time the selection point passes around the full loop of possible numbers, it moves forward by one place due to the missing zero. The selection process will pass through the full loop 32 times before getting back to the start value.
Scaling the Output
The raw 32-bit numbers supplied by the generator needs to be scaled to the needs of the software it serves. Suppose you wanted a random number in the range 0-9. If you divide the range of that request (10) into the range of numbers available (4294967295) the remainder is 5.
This remainder increases the odds of obtaining numbers in the range 0-5 and the statistical randomness has been reduced. The larger the number range being requested, the larger the bias may become.
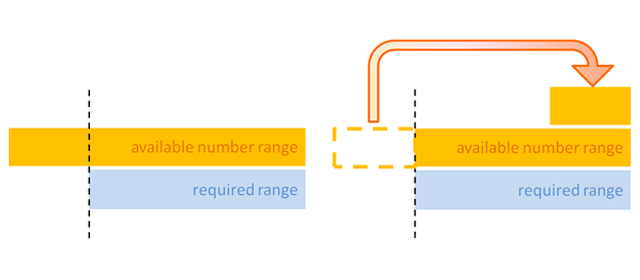
A better way to obtain
Confine the Result to 9 Significant Digits
The fraction obtained by dividing the possible outputs (excluding zero) with the total number of possible outputs (including zero) is
4294967294 / 4294967295 = 0.9999999997671694
Only a value of 9 in the fraction permits a complete of range values so the 7 imprecise trailing digits must be discarded. By doing this the scope of the generator becomes clear, manageable and well within the range of the ‘double’ data type. The random fraction would then be in the range:
0 to 0.999999999
The raw numbers output from the RNG do not contain zero, but we will shift the output down by one in order to represent the fraction correctly, and that will include a zero. This is equivalent to 1 billion positive fractions.
If your target number is larger than 9 decimal places, constants will occur evenly throughout the set of numbers starting at the 10th significant position. The good thing about this is that the errors are small compared to the number range and this minimises the impact on the application.
You should always make sure that the available precision of 9 significant digits will correctly support your desired scenario.
Testing the RNGs
The Test Environment
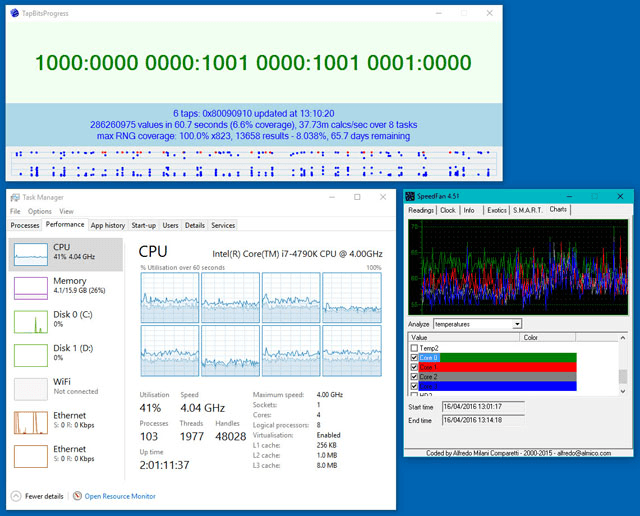
A generic testing program was developed to manage all of the general and specific test ranges. The program had to be able to resume operation after Windows restarts. It utilised tasks that ran on separate CPU’s and the CPU usage was limited to 43% to prevent the
The inclusion of CPU usage controls also meant that the program would automatically stop using resources when the computer became busy and then continue processing afterwards. I could run a very demanding application and the test program would retreat into minimal activity during that time.
In this way, the program could work automatically, healthily and unobtrusively for several months at a time.
Testing the permutations for all tap bits from 1 to 32 would have taken hundreds of years. To make forays into the larger data sets, a random approach to sampling specific patterns made and extrapolated.
Testing the 4-tap RNGs
From a practical point of view, the least number of tap points that provides 100% coverage provides the speediest solution, and 4 tap points fulfills the goal.
There are 178 4-tap patterns that will produce a full sequence length before repeating. All of the available numbers are used once. Different tap patterns generate the set of numbers in a different order. Its the same as counting 1,2,3 … up to 4 thousand million, but in a different order.
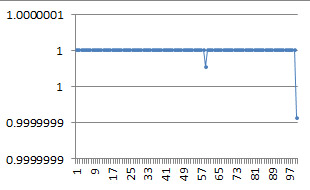
The distribution of values was accumulated and scaled to 100%. We can see from the example graph that the output is very good. Each 1% occurs just slightly above 1% of the time and two positions are very slightly less frequent.
It’s likely that the slightly imprecise representation of decimal digits in a binary system has lead to a minute drop in all the numbers such that the highest position is slightly less populated and all the lower numbers acquire the overspill.
Separate runs were made in which a rounding function was used to combat this slight numerical sagging effect. By rounding away from zero to 9 significant places, I had hoped to push the numbers back up the range and flatten out the distribution a little more. The result contained more spikes and a worse range than the plain result shown above, and will not be used.
The Difference Distribution
Here, we are examining the frequency of the difference between successive random numbers… how many are big, small or medium. What we don’t want is any bunching up of the data as this represents a skewing of the probability of the RNG. The smoother the result the more evenly distributed is the RNG output the m
Each full-length tap pattern provides a different sequence of numbers and this changes the frequency of the differences between successive random numbers. The size of that difference varies and we would want to see a good distribution. In other words, sometimes the next random number might be close to the current one, and sometimes a large distance away. We would like as much variation as possible.
The differences between successive numbers were gathered into 100 bins where each bin is 1% of the full range. The first bin counter is incremented each time a number from 1 to 42949673 is encountered, and so on for each successive bin.
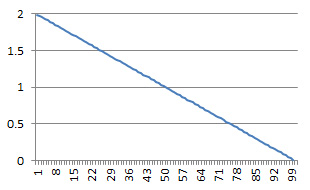
The frequencies were converted to a percentage (refer to graph). The x-axis represents 100 bins. The y-axis is the frequency of the bin expressed as a percentage of the maximum value.
The graph shows that the frequency of differences between successive random numbers in the range 1 to 42949673 (the left-hand side of the x-axis) is nearly 2% of the full set. It also shows that nearly full-length differences (the right-hand side of the x-axis) are being generated and that the scale between the largest and smallest differences is smooth for all of the offsets in between.
In plain english, this means that there are more short numerical jumps between successive random values than there are long jumps, but the preference is not strong.
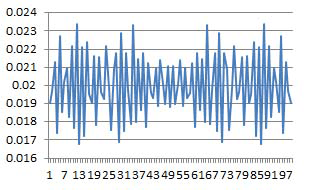
You will notice that the trace exhibits a small wobble when you view it closely. This is the equivalent of the probability bunching up over some values and sagging over others. To understand this I began examining the difference between successive frequencies.
The Difference of Frequencies
To make this wobble In the difference distribution clearer, a graph was made of the difference between successive frequencies. The x-axis represents increasing size difference %. The y-axis is the difference between each neighbour as a fraction of a %. The graph reveals a cyclic pattern on the x-axis and a range in the variation on the y-axis.
Finalising the Results
Comparing Graphs
Here are graphical results from three of the 178 tests.
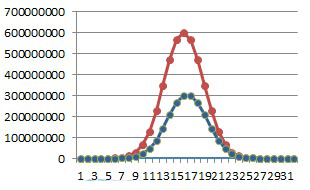
The first column of blue traces shows that the random number generators provide the same distribution of values. This is to be expected because all of the RNGs output the same set of numbers, albeit in a different order, and the distribution graph is not sensitive to the order of the numbers.
The second column of red graphs shows the frequency of differences between successive random numbers. Of these, the first graph has a very jagged appearance. It was found by searching all 178 results for the smallest range of differences overall. We can see this is not a good metric to use since the range of differences swings wildly compared to the others. It’s probabilities are not very even at small scales.
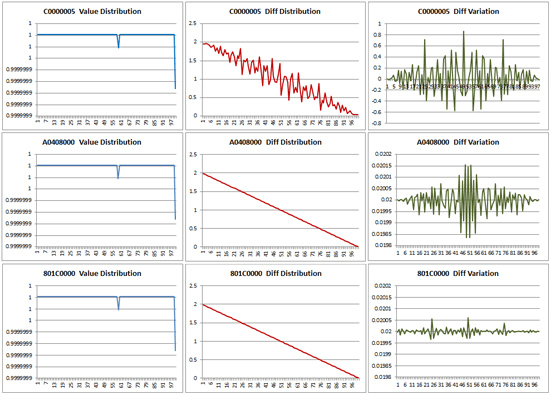
The third column of green graphs shows the differences between successive frequencies (as shown in the 2nd column). Although the top and middle graphs look similar, the middle graph is 10 times smaller on the y-axis and so exhibits much smoother probability.
The graph in the last row has the least variation of all the 178 possible tap patterns. Its scale is the same as the one above so you can directly compare the range and variation. It is much quieter and more evenly distributed and so will provide the best probability output.
Choosing the Best Tap Pattern
In fact, all of the 4-tap random number generators work well and the differences between them are reasonably small. For most applications, the variation of the different RNGs probably wouldn’t be significant, but we will want to use the best one possible.
Note: RNGs are not suitable for encryption or financial applications. They can be a good or bad choice for science experiments, testing, and games, depending on how it is implemented and what you are trying to achieve.
The Best 4-Tap RNG
I used a standard deviation comparison of the differences between all the RNG configuration to find the best one. Here is the winner:
best tap pattern
801C0000
hexadecimal
You can see its performance in the bottom row of the comparison graphs in Fig-11.
Conclusion
The simple XOR shift RNG makes an excellent source of pseudo-random numbers, especially when all its bits are refreshed for each call and the number is supplied in the form of a positive fraction with 9 significant digits (as described above).
The analysis has shown that the distribution of values is very even, the range of differences between successive numbers varies enormously and distribution of differences are also very smooth for the recommended tap pattern value.
Personally, I feel a lot happier knowing what the scope of the number generator is and how it performs, so I will be making use of this code myself shortly.
Implementation
A C# Class Download
Here is a present! – the class used to test out all of the above. You might be able to make it faster since this was tailored to be useful to try out all permutations available whereas only 1 pattern is needed to provide the best output.
You should test the output to ensure that you have the code set up correctly. The first test you can do is check that you have a full-length sequence. To do that, take a number from the output and then count how many numbers are generated before the sampled number comes around again. The result should be a count of 0xffffffff.
Pseudo Code
Assuming that the C# class supplied above isn’t quite what you are looking for, here is the pseudo code to obtain 4,294,967,295 random fractions in the range 0 to 0.999999999.
The informal notation used in my description is:
UInt32 : an unsigned 32 bit integer
double : a real number with 15 digits precision
‘Ox‘ : a hex value follows
‘&’ : a bitwise AND operation
Note: To initialise the code set, rngValue to any non-zero value before you start.
Variables:
double maxRngValue = 0xFFFFFFFF – 1;
double maxFraction = 0.999999999
UInt32 rngValue;
To acquire a single value:
Loop for 32 times
UInt32 tapValue = 0
If rngValue & 80000000 > 0 then tapValue = tapValue xor 1
If rngValue & 100000 > 0 then tapValue = tapValue xor 1
If rngValue & 80000 > 0 then tapValue = tapValue xor 1
If rngValue & 40000 > 0 then tapValue = tapValue xor 1
shift rngValue left 1 place
rngValue = rngValue or’d with tapValue
End loop
double resultFraction = maxFraction * ((rngValue – 1) / maxRngValue)
The -1 makes the result zero-based, bearing in mind zero will not be generated.
You can optimise the above code by using a UInt32 to hold the original random number for bit testing and putting the result directly into a shifted version of the original number.
The computer time required to check every permutation of all tap bits makes investigating these generators by brute force impossible on current machines. For practical purposes, I only needed to find the complete set of the least number of tap bits. In reality, I have sampled across the whole set as well, just for the fun of detecting and managing new properties and problems.
Mentions

As you can see, I’ve put a large amount of time and effort into investigating this code, and I would appreciate being credited for this software, including a link to this website. I hope you will find the months of research useful. It has been a truly interesting project.
Disclaimer
Care has been taken to keep the information in this article as accurate as possible but errors are possible, so be aware of the full disclaimer here.